![]()
 |
![]()
Decision trees are the most popular method for data analysis and classifier construction. With the dtree package I provided a set of command line programs written in C, with which decision and regression trees can be grown and pruned as well as executed on new data. However, these programs lacked a graphical user interface and, in particular, the possibility to visualize a learned decision or regression tree. This drawback is amended with this decision and regression tree visualization program written in Java. This is not a full graphical user interface, but only a pure viewer. The full graphical user interface can be found here.
Enjoy,
Christian Borgelt
| back to the top |  |
![]()
To start the program from the jar file, type java -jar dtview.jar, to start it from the compiled sources, type java dtview.DTView. A decision or regression tree may then be loaded by selecting File > Load Tree... Alternatively, the name of file containing the decision or regression tree to display may be stated on the command line. Example decision tree files can be found in the source package in the directory dtview/data.
| back to the top | |
![]()
The following picture explains the layout of a decision tree and the meaning of the different fields of a node. It shows a decision tree for the well-known iris data, which is a data set containing measurements of the petal length and width and the sepal length and width of three types of iris flowers.
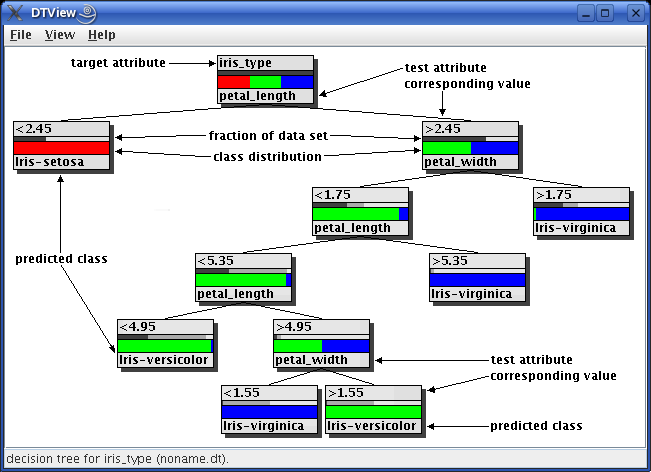
In the root node, shown at the top, the upper label field contains the name of the target attribute of the decision tree, in this case iris_type. For all other inner nodes and for all leaves the upper label field contains the branch value of the attribute tested in the parent node, for example < 2.45. For all inner nodes the lower label field shows the name of the attribute tested in this node (here either petal_length or petal_width, so the condition that corresponds to the value named above is petal_width < 2.45). For leaves it shows the name of the most frequent class, which will be predicted if a case is classified with this leaf node. For this example the class is one of Iris-setosa, Iris-virginica and Iris-versicolor.
Between the two label fields there are two bar diagrams, the upper of which shows as a dark gray bar the fraction of the training data set that falls to this node, thus indicating the importance of the subtree. The lighter gray bar (which also counts from the left side of the node and thus is, in a way, "behind" the dark gray bar) shows the fraction of sample cases relative to those assigned to the parent node.
The lower bar diagram shows the class distribution, with one color for each class that is present in the node. The width of each color bar indicates the fraction of cases assigned to this node that have the corresponding class.
For regression trees the lower bar (which shows the class distribution for a decision tree) is replaced by a bar showing the domain of the target attribute. The picture below shows a regression tree for the iris data as an example, with which the petal width is predicted from the other attributes.
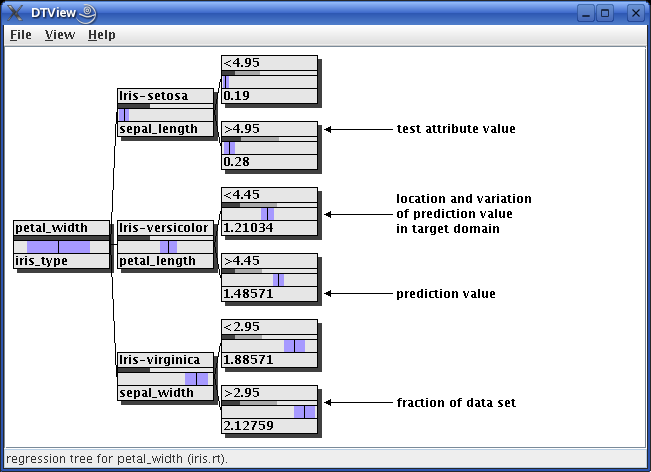
The target value predicted in a node is indicated by a thin black vertical line. The variation around this value in the data set the tree was induced from is shown as a violet bar, which extends from the predicted value minus one standard deviation to the predicted value plus one standard deviation. The other fields of a node have the same meaning as for a decision tree.
| back to the top | |
![]()
For large decision trees it is desirable to be able to fold subtrees, so that they do not obstruct the view to the more important parts of the tree. A subtree may be folded and unfolded by simply clicking on the inner node at which it is rooted. As an example the following picture shows the same decsion tree as above with a folded subtree.
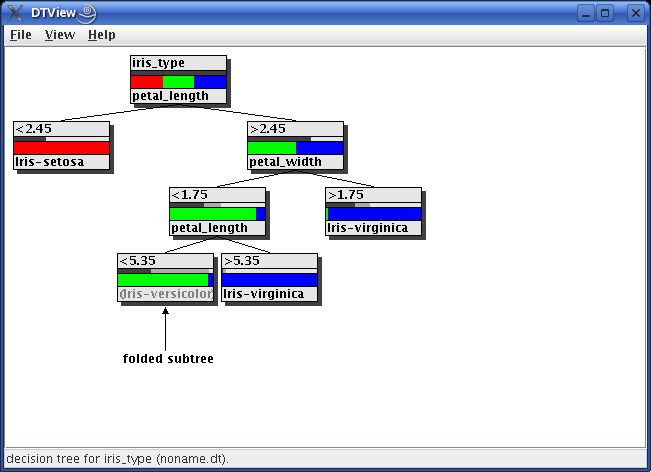
Note that a folded subtree can be identified by the gray lower label, which now shows the class that would be predicted here if this subtree were pruned to a leaf (instead of the test attribute for an unfolded subtree).
A click with the left mouse button only (un)folds the node clicked on, while a click with the right mouse button opens a popup menu, with which the whole subtree may be (un)folded, that is, all nodes in this subtree are (un)folded. This popup menu also offers the possibility to prune the tree manually, that is, to turn a subtree into a leaf node. Note that folding a node/subtree can be undone, whereas pruning can not.
A manually pruned decision tree may be written to a file by selecting File > Save Tree or File > Save Tree as...
| back to the top | |
![]()
The layout of the tree can be adapted in a very flexible way.
Selecting View > Set Layout... opens the following dialog box:
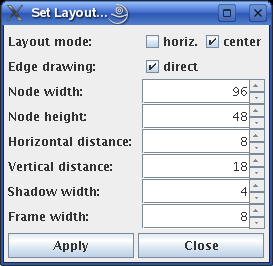
In this box the layout mode (whether horizontal or vertical and whether parents should be centered or the layout should proceed from left to right or from top to bottom, respectively), the style of the connecting edges (direct or angled), the size of the decision tree nodes, their horizontal and vertical distance, the size of the shadows they throw, and the width of the frame around the whole decision tree can be specified.
Selecting View > Set Font... opens the following dialog box:
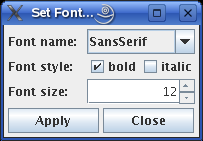
In this box the standard Java attributes can be chosen for the font that is used for the node labels. The name of the font determines its look. The style can be modified to bold or italic (or both). The size of the font is stated in points.
Note that the bars in the middle of a decision tree vanish if the font size is too large to allow for such bars. However, a decision tree node will always have the two label fields, regardless of the specified node height, because the node height is adapted according to the chosen font size.
| back to the top | |
![]()
The decision and regression tree viewer can also be used as a command line program to generate images of decision or regression trees without opening the viewer window. This mode is triggered by an invocation that specifies two arguments on the command line, for example java dtview.DTView iris.dt iris.png: the first is the name of the file containing the decision tree to visualize, the second the name of the PNG image file to write.
The layout and font parameters of the program (as they can be set with the dialog boxes described above) can be specified on the command line as follows:
| -r | horizontal instead of vertical layout | |
| -c | switch off centered layout | |
| -d | switch off direct edge drawing | |
| -w# | node width in pixels (default: 96) | |
| -h# | node height in pixels (default: 48) | |
| -x# | horizontal distance between nodes in pixels (default: 8) | |
| -y# | vertical distance between nodes in pixels (default: 18) | |
| -s# | shadow width/shift in pixels (default: 4) | |
| -f# | frame width around tree in pixels (default: 8) | |
| -a# | use font with name '#' (default: "SansSerif"; other options are "Serif", "Monospaced", "Dialog", and "DialogInput") | |
| -b | do not use bold font | |
| -i | use italic font | |
| -z# | font size in points (default: 12) |
If no options are given, the decision or regression tree is rendered with the default layout parameters. The options are also effective if only one command line argument is given. In this case they determine the initial layout of the decision or regression tree.
| back to the top | |
![]()
(MIT license, or more precisely Expat License; to be found in the file mit-license.txt in the directory regress/doc in the source package, see also opensource.org and wikipedia.org)
© 2004-2014 Christian Borgelt
Permission is hereby granted, free of charge, to any person obtaining a copy of this software and associated documentation files (the "Software"), to deal in the Software without restriction, including without limitation the rights to use, copy, modify, merge, publish, distribute, sublicense, and/or sell copies of the Software, and to permit persons to whom the Software is furnished to do so, subject to the following conditions:
The above copyright notice and this permission notice shall be included in all copies or substantial portions of the Software.
THE SOFTWARE IS PROVIDED "AS IS", WITHOUT WARRANTY OF ANY KIND, EXPRESS OR IMPLIED, INCLUDING BUT NOT LIMITED TO THE WARRANTIES OF MERCHANTABILITY, FITNESS FOR A PARTICULAR PURPOSE AND NONINFRINGEMENT. IN NO EVENT SHALL THE AUTHORS OR COPYRIGHT HOLDERS BE LIABLE FOR ANY CLAIM, DAMAGES OR OTHER LIABILITY, WHETHER IN AN ACTION OF CONTRACT, TORT OR OTHERWISE, ARISING FROM, OUT OF OR IN CONNECTION WITH THE SOFTWARE OR THE USE OR OTHER DEALINGS IN THE SOFTWARE.
| back to the top | |
![]()
Download page with most recent version.
| back to the top | |
![]()
| E-mail: |
christian.borgelt@softcomputing.es christian@borgelt.net | |
| Snail mail: Old |
Christian Borgelt Intelligent Data Analysis and Graphical Models Research Unit European Center for Soft Computing Edificio Cientifico-Tecnológico, 3a Planta c/ Gonzalo Gutiérrez Quirós s/n 33600 Mieres Asturias, Spain | |
| Phone: | +34 985 456545 | |
| Fax: | +34 985 456699 |
| Old E-mail: |
christian.borgelt@cs.uni-magdeburg.de borgelt@iws.cs.uni-magdeburg.de | |
| Old Snail mail: |
Christian Borgelt Working Group Neural Networks and Fuzzy Systems Department of Knowledge Processing and Language Engineering School of Computer Science Otto-von-Guericke-University of Magdeburg Universitätsplatz 2 D-39106 Magdeburg Germany | |
| Old Phone: | +49 391 67 12700 | |
| Old Fax: | +49 391 67 12018 | |
| Old Office: | 29.015 |
| back to the top | |
![]()